
This article provides a brief overview of the crime trends and patterns in Malaysia with an emphasis on the states of Kuala Lumpur and Selangor between the years 2010-2017. The purpose of this paper is to study the general trends of the different types of crimes that occur in the country to gain an understanding of the crimes that are most prevalent and the states with the highest frequencies of crime. This is an important precursor to further research into the causes of crime in the country. Data from the Department of Statistics Malaysia and Ministry of Home Affairs were collected and analysed. The national index and property crime rate per 100,000 of the population is found to be decreasing whereas the violent crime rate shows a steady pattern. 42.4% of the total index crimes in Malaysia between 2010 and 2017 occurred in Kuala Lumpur and Selangor. A descriptive analysis of the crime rates in Kuala Lumpur and Selangor shows that unarmed robbery and vehicle theft are the most frequent crimes in both states.
Introduction
According to the Annual Crime and Safety Report 2018, published by the Overseas Security Advisory Council (OSAC) under the United States Bureau of Diplomatic Security, Kuala Lumpur was listed as a ‘HIGH-threat’ location for crime. 1 Crime is an issue of concern in the country and often finds the attention of the media. In a major effort to combat crime, the Government Transformation Programme (GTP), introduced in 2010, listed “Reducing Crime” as one of the National Key Result Areas (NKRA) headed by the Ministry of Home Affairs. Its main objective was to tackle pressing issues of public safety and crime. This paper gives a brief descriptive overview of the trends and patterns of crime in Malaysia with an emphasis on Kuala Lumpur (KL) and Selangor between 2010 and 2017.
Classifications of Crime in Malaysia
The Royal Malaysian Police (RMP) uses the term “index crime” as a measure of the general crime situation in the country. Index crimes are defined as –
Crimes that are reported with sufficient regularity and with sufficient significance to be meaningful as an index to the crime situation. 2
In other words, an index crime is a crime that is regular and common enough to be included in the index. Index crimes can be further divided into violent crimes and property crimes. Violent crimes constitute murder, rape, robbery with or without firearm, gang robbery with or without firearm and causing voluntary harm or assault. Property crime constitutes house break-in and theft, snatch theft, vehicle theft 3 and other theft. Mathematically speaking, the number of index crimes is the sum of the number of property and violent crimes. For a crime to be classified as an index crime, it has to be reported to the police. 4 Crimes that are unreported are not included in the index. It must be understood that index crime classifications differ between countries. This is because the regularity of crimes is unique to the particular country.
Descriptive Statistics and Analysis
Crime Trends in Malaysia
Figure 1
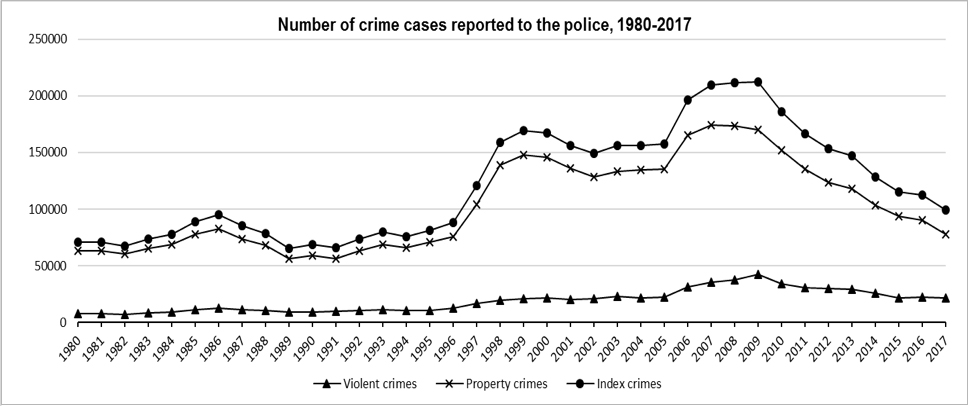
Figure 1 5 shows the index, property and violent crime trends in Malaysia from 1980-2017. Property crimes consist of 85% of the index crimes in Malaysia. They show a more volatile pattern as compared to violent crimes. The two peaks in the number of reported property crime cases are consistent with the periods of economic downturn in the country, namely the Asian and global financial crises respectively. This shows a possible correlation between property crimes and the economic situation in Malaysia. This pattern suggests that property crimes are largely income or money driven. Violent crimes, on the other hand, are also dependent on other behavioural factors of the offender such as psychopathy, impulsivity, low self-control and aggressive behaviour. 6
Figure 2
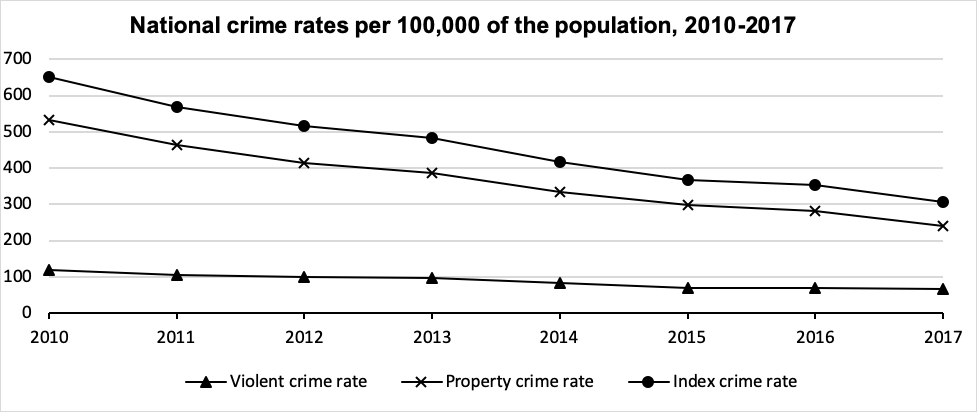
Figure 2 shows a general decline in the national index and property crime rates. The property crime rate decreased by 55% between 2010 and 2017 whereas the violent crime rate decreased by 45%. The decline in property crime rates, however, may be due to under-reporting which is one of the largest limitations in crime data all over the world.
Figure 3

From Figure 3, 7 the states with the highest average index crime rates per 100,000 of the population between 2010 and 2017 are KL and Selangor respectively. 42.4% of the total index crimes occurred in the states of KL and Selangor. The index crime rates in KL and Selangor are considered to be high as compared to Singapore which had an index crime rate of 431.3 per 100,000 of the population in 2016. 8
Analysis of Crimes in KL and Selangor 9
Figure 4
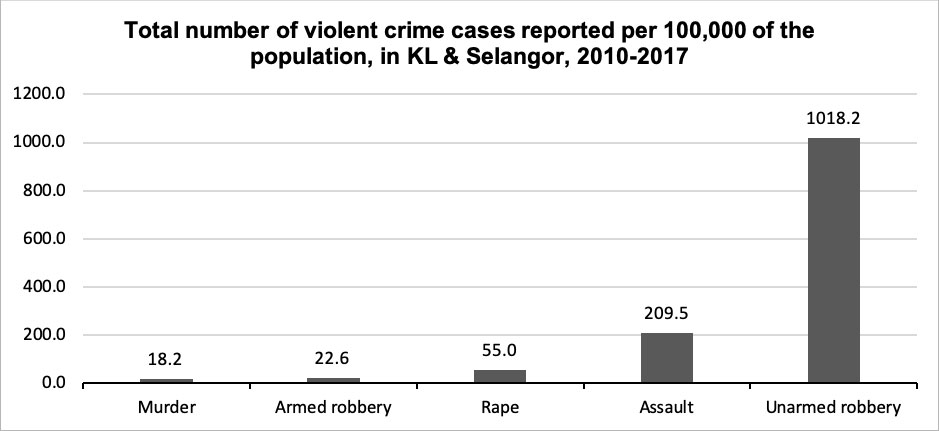
Figure 5
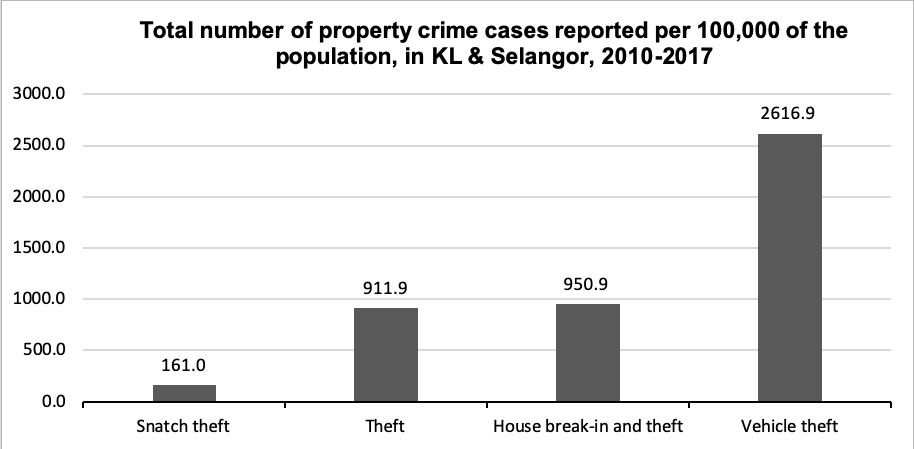
Figure 4 and Figure 5 show that unarmed robbery and vehicle theft are the highest reported crimes per 100,000 of the population in KL and Selangor. Contrary to popular belief, murder and snatch theft are the lowest as compared to the other violent and property crimes respectively. In terms of percentages, 48.5% of the total national violent crimes and 41% of the total national property crimes were reported in KL and Selangor.
Table 1 : Violent crime rate per 100,000 of the population in KL and Selangor, by type, 2010-2017
|
Violent crimes/Year |
2010 |
2011 |
2012 |
2013 |
2014 |
2015 |
2016 |
2017 |
|
Unarmed robbery |
141.6 |
151.0 |
155.7 |
164.2 |
125.2 |
94.9 |
96.2 |
97.2 |
|
Assault |
41.7 |
30.0 |
25.3 |
23.8 |
22.4 |
24.0 |
23.1 |
21.1 |
|
Armed robbery |
18.2 |
3.4 |
0.5 |
0.6 |
0.6 |
0.3 |
0.3 |
0.2 |
|
Rape |
11.2 |
8.9 |
7.3 |
6.9 |
5.8 |
5.3 |
4.8 |
5.4 |
|
Murder |
3.3 |
2.2 |
2.8 |
2.9 |
1.9 |
2.1 |
1.8 |
1.4 |
|
Total |
216.0 |
195.5 |
191.6 |
198.4 |
155.8 |
126.8 |
126.3 |
125.3 |
Source: MOHA and DOS (Author’s calculations)
Table 1 shows the trends in violent crime rates in KL and Selangor. Unarmed robbery is the highest reported violent crime whereas murder is the lowest. The unarmed robbery rate increases between 2010 and 2013 and thereafter decreases. The average unarmed robbery rate is approximately 56 times higher than the average murder rate.
Table 2: Property crime rate per 100,000 of the population in KL and Selangor, by type, 2010-2017
|
Property crimes/ Year |
2010 |
2011 |
2012 |
2013 |
2014 |
2015 |
2016 |
2017 |
|
Vehicle theft |
428.8 |
412.7 |
399.9 |
385.2 |
311.2 |
269.7 |
240.8 |
198.0 |
|
House break-in and theft |
198.9 |
160.1 |
120.6 |
131.7 |
105.3 |
95.3 |
89.5 |
63.7 |
|
Theft |
188.2 |
140.4 |
109.7 |
109.8 |
99.1 |
88.4 |
102.0 |
84.6 |
|
Snatch theft |
43.4 |
23.5 |
14.6 |
15.4 |
18.1 |
19.2 |
27.6 |
1.8 |
|
Total |
859.3 |
736.7 |
644.7 |
642.1 |
533.7 |
472.7 |
460.0 |
348.1 |
Source: MOHA and DOS (Author’s calculations)
Table 2 shows the trends in property crime rates in KL and Selangor. Vehicle theft is the highest reported property crime and snatch theft is surprisingly the lowest. The vehicle theft rate decreases by more than half (53.8%) between 2010 and 2017. The average vehicle theft rate is approximately 16 times higher than the average snatch theft rate.
Comparing Table 1 and Table 2, the rates of property crimes are much higher than the rates of violent crimes. This shows that property crimes are much more prevalent than violent crimes. The average vehicle theft rate is 2.6 times higher than the average unarmed robbery rate and 144 times higher than the average murder rate.
Limitations of Crime Data
One of the biggest challenges in conducting crime research is the accuracy and reliability of crime data. There are at least two major factors that contribute to limitations in crime data. The first limitation is the phenomenon of under-reporting where people do not report crimes. This is a major issue that contributes to a large number of cases not ending up in the official statistics. These numbers are known as the ‘dark figures’ of crime. 10 In fact, the decision to report crimes is subject to many reasons, for example, the location where it took place, the type of crime and the seriousness of the crime. According to a survey carried out by the Malaysian Chinese daily Nanyang Siang Pau in 2004, only approximately 50% of the crime victims that they interviewed reported the actual crime. 11 The most common reasons for not reporting crimes according to the survey were that most of them felt the police could not help (45.2%) and that there was no evidence (29%). 12 These reasons were similar to the British Crime Survey findings in 2007 who found that the most common reasons for not reporting crimes were believing that the police could not do anything and the incidents were too trivial (involved very minor losses). 13 An article by Dr. Amin Khan who was the Director of PEMANDU’s 14 “Reducing Crime” NKRA unit, revealed that in Malaysia, there were dark figures of around 7% for car theft, 70% for common assault and 90% for theft which highlights the seriousness of under-reporting in the country. 15Another limitation to crime data is the fact that crime data is subject to the accuracy of data classification by the agencies who collect data. There is no guarantee that all reported offences will end up in the official statistics. It is not uncommon for data to be ‘included’ or ‘excluded’ from the official crime index in order to meet certain governmental or departmental targets. 16 Cases that are sometimes classified as No Offence Declared (NOD), Refer to Magistrate (RTM) or No Further Action (NFA) upon investigation may have a criminal element but their inclusion in the index is subject to the discretion of the investigator. 17
Conclusion
This article provides a brief overview and a preliminary analysis of the trends and patterns of crime in Malaysia with an emphasis on the states of Kuala Lumpur and Selangor. Data from the Department of Statistics and Ministry of Home Affairs were collected and analysed. The national violent and property crime rates per 100,000 of the population decrease between 2010 and 2017. 42.4% of the total index crimes in Malaysia between 2010 and 2017 occurred in the states of Kuala Lumpur and Selangor. The most common crimes in Kuala Lumpur and Selangor are unarmed robbery and vehicle theft although the number of reported cases between 2010 and 2017 has been decreasing.
Rueben Ananthan Santhana Dass
Rueben Ananthan Santhana Dass is a former research intern at Khazanah Research Institute, a policy based think tank based in Kuala Lumpur, Malaysia
srueben92@gmail.com
Banner image Shutterstock.com
Kyoto Review of Southeast Asia, Trendsetters, August 2019
References
DOS. “Social Statistics Bulletin 2012.” Putrajaya: Department of Statistics, 2012.
———. “Social Statistics Bulletin 2013.” Putrajaya: Department of Statistics, 2013.
———. “Social Statistics Bulletin 2014.” Putrajaya: Department of Statistics, 2014.
———. “Social Statistics Bulletin 2015.” Putrajaya: Department of Statistics, 2015.|
———. “Social Statistics Bulletin 2016.” Putrajaya: Department of Statistics, 2016.|
———. “Social Statistics Bulletin 2017.” Putrajaya: Department of Statistics, 2017.|
Jansson, Krista. “British Crime Survey – Measuring Crime for 25 Years,” 2007.
Khan, Dr. Amin. “Throwing Light on Crime Statistics.” The Star Online, April 19, 2015, sec. Nation. https://www.thestar.com.my/news/nation/2015/04/19/throwing-light-on-crime-statistics-it-is-not-just-about-the-numbers-but-what-we-do-about-them-that-m/.
MOHA. “MAMPU Database.” Online, 2018. http://www.data.gov.my/data/ms_MY/dataset?organization=ministry-of-home-affairs&page=6.
Mohammad Rahim, Kamaluddin, Othman Azizah, Ismail Khaidzir, and Mat Saat Geshina Ayu. “Aggression Profiles of Incarcerated Malaysian Male Murderers.” Akademika 86, no. 02 (October 31, 2016). https://doi.org/10.17576/akad-2016-8602-11.
Overseas Security Advisory Council. “Malaysia 2018 Crime & Safety Report.” Online, 2018. https://www.osac.gov/pages/ContentReportDetails.aspx?cid=23774.
Sidhu, ACP Amar Singh. “Crime Levels and Trends in the next Decade.” Journal of the Kuala Lumpur Royal Malaysian Police College, no. 5 (2006): 1–13.
———. “The Rise of Crime in Malaysia: An Academic and Statistical Analysis.” Journal of the Kuala Lumpur Royal Malaysian Police College, no. 4 (2005): 1–28.
Singapore Police Force. “Singapore Annual Crime Brief.” Singapore: Singapore Police Force, 2017. http://www.police.gov.sg/news-and-publications/statistics?year=2017&category=Crime%20Situation.
Syariani, Nadiah, A. Othman, I. Khaidzir, and Geshina Ayu. “Personality Profiles of Malaysian Male Prisoners Convicted of Murder.” Malaysian Journal of Psychiatry 23, no. 1 (2014): 4–16.
Woodworth, Michael, and Stephen Porter. “In Cold Blood: Characteristics of Criminal Homicides as a Function of Psychopathy.” Journal of Abnormal Psychology 111, no. 3 (2002): 436–45. https://doi.org/10.1037/0021-843X.111.3.436.
Notes:
- Overseas Security Advisory Council, “Malaysia 2018 Crime & Safety Report,” Online, 2018, https://www.osac.gov/pages/ContentReportDetails.aspx?cid=23774. ↩
- ACP Amar Singh Sidhu, “The Rise of Crime in Malaysia: An Academic and Statistical Analysis,” Journal of the Kuala Lumpur Royal Malaysian Police College, no. 4 (2005): 1–28. ↩
- Vehicle theft includes theft of cars, motorcycles, scooters, vans and lorries. ↩
- Sidhu, “The Rise of Crime in Malaysia: An Academic and Statistical Analysis.” ↩
- DOS, “Social Statistics Bulletin 2012” (Putrajaya: Department of Statistics, 2012); DOS, “Social Statistics Bulletin 2013” (Putrajaya: Department of Statistics, 2013); DOS, “Social Statistics Bulletin 2014” (Putrajaya: Department of Statistics, 2014); DOS, “Social Statistics Bulletin 2015” (Putrajaya: Department of Statistics, 2015); DOS, “Social Statistics Bulletin 2016” (Putrajaya: Department of Statistics, 2016); DOS, “Social Statistics Bulletin 2017” (Putrajaya: Department of Statistics, 2017); MOHA, “MAMPU Database,” Online, 2018, http://www.data.gov.my/data/ms_MY/dataset?organization=ministry-of-home-affairs&page=6. ↩
- Kamaluddin Mohammad Rahim et al., “Aggression Profiles of Incarcerated Malaysian Male Murderers,” Akademika 86, no. 02 (October 31, 2016), https://doi.org/10.17576/akad-2016-8602-11; Michael Woodworth and Stephen Porter, “In Cold Blood: Characteristics of Criminal Homicides as a Function of Psychopathy.,” Journal of Abnormal Psychology 111, no. 3 (2002): 436–45, https://doi.org/10.1037/0021-843X.111.3.436; Nadiah Syariani et al., “Personality Profiles of Malaysian Male Prisoners Convicted of Murder,” Malaysian Journal of Psychiatry 23, no. 1 (2014): 4–16. ↩
- Singapore Police Force, “Singapore Annual Crime Brief” (Singapore: Singapore Police Force, 2017), http://www.police.gov.sg/news-and-publications/statistics?year=2017&category=Crime%20Situation. ↩
- [1] Singapore Police Force, “Singapore Annual Crime Brief” (Singapore: Singapore Police Force, 2017), http://www.police.gov.sg/news-and-publications/statistics?year=2017&category=Crime%20Situation. ↩
- We consider the states of KL and Selangor as one state for the purposes of this analysis. ↩
- Sidhu, “The Rise of Crime in Malaysia: An Academic and Statistical Analysis.” ↩
- ACP Amar Singh Sidhu, “Crime Levels and Trends in the next Decade,” Journal of the Kuala Lumpur Royal Malaysian Police College, no. 5 (2006): 1–13. ↩
- Sidhu. ↩
- Krista Jansson, “British Crime Survey – Measuring Crime for 25 Years,” 2007. ↩
- PEMANDU is a Malaysian private consultancy firm who works closely with the government and advises them on policy related issues. ↩
- Dr. Amin Khan, “Throwing Light on Crime Statistics,” The Star Online, April 19, 2015, sec. Nation, https://www.thestar.com.my/news/nation/2015/04/19/throwing-light-on-crime-statistics-it-is-not-just-about-the-numbers-but-what-we-do-about-them-that-m/. ↩
- Sidhu, “The Rise of Crime in Malaysia: An Academic and Statistical Analysis.” ↩
- Sidhu. ↩